

Introduction
- In this article we will solve Histogram of Tweets SQL question which is asked by Microsoft as per DataLemur website.
If you don’t know DatLemur then please do visit , it’s one of the best website to practice SQL questions and improve your SQL skills.
Question
- We have been given tweets table that consist of each tweet made by twitter user.
- We have to get histogram of tweet per user made in 2022.
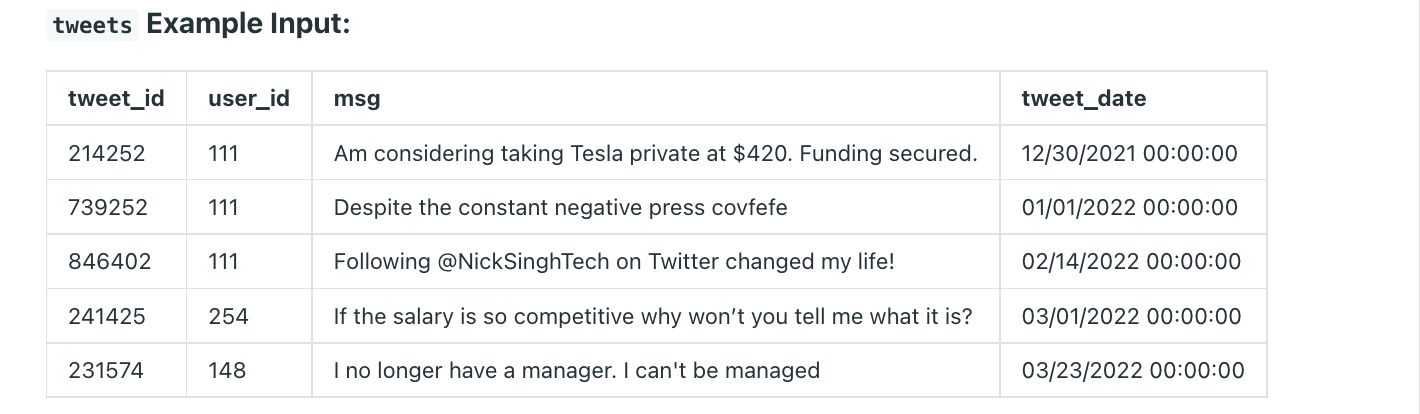
- Output contain the tweet _bucket and number of user who made that many tweets. for example, 2 users made 1 tweet in 2022.

Solution
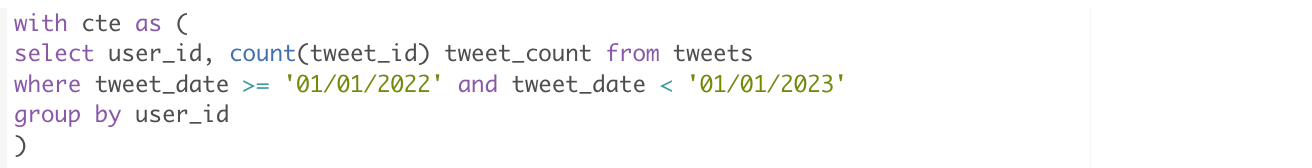
- We will first count number of tweets made by each user in 2022. We can group by on user_id and filter based on tweet_date as show below.
- We have created CTE ( common table expression ) which acts as base table for us.
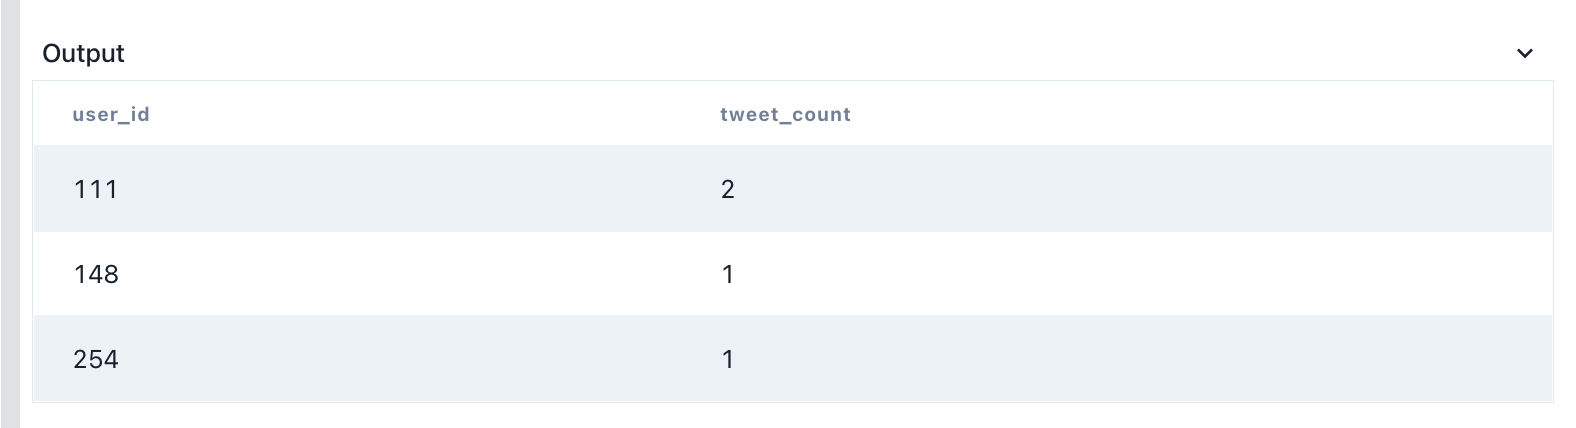
- Once we have number of tweets for each user in 2022. Then all we have to do is count the occurrence of number of tweets , thats what histogram is all about.
- For example there are 4 occurrence of user having number of tweets equal to 1, then histogram would be 4.


here is the final solution
with cte as (
select user_id, count(tweet_id) tweet_count from tweets
where tweet_date >= '01/01/2022' and tweet_date < '01/01/2023'
group by user_id
)

select tweet_count as tweet_num, count(user_id) as user_num from cte
group by tweet_count;
Submission
- Our solution is accepted by platform.

Conclusion
- In this article we solved SQL question asked by Twitter. We learned how we can use CTE , that common table expression to setup our based table and get the aggregation on top of it.
Bonus Tip
- If you want to upskill your SQL interview game, you can definitely check out this bestseller course